Solar Wind Anisotropies
SOHO was launched during solar minimum and SWAN has been monitoring solar cycle variations till now, throughout the ascending phase of the solar cycle.
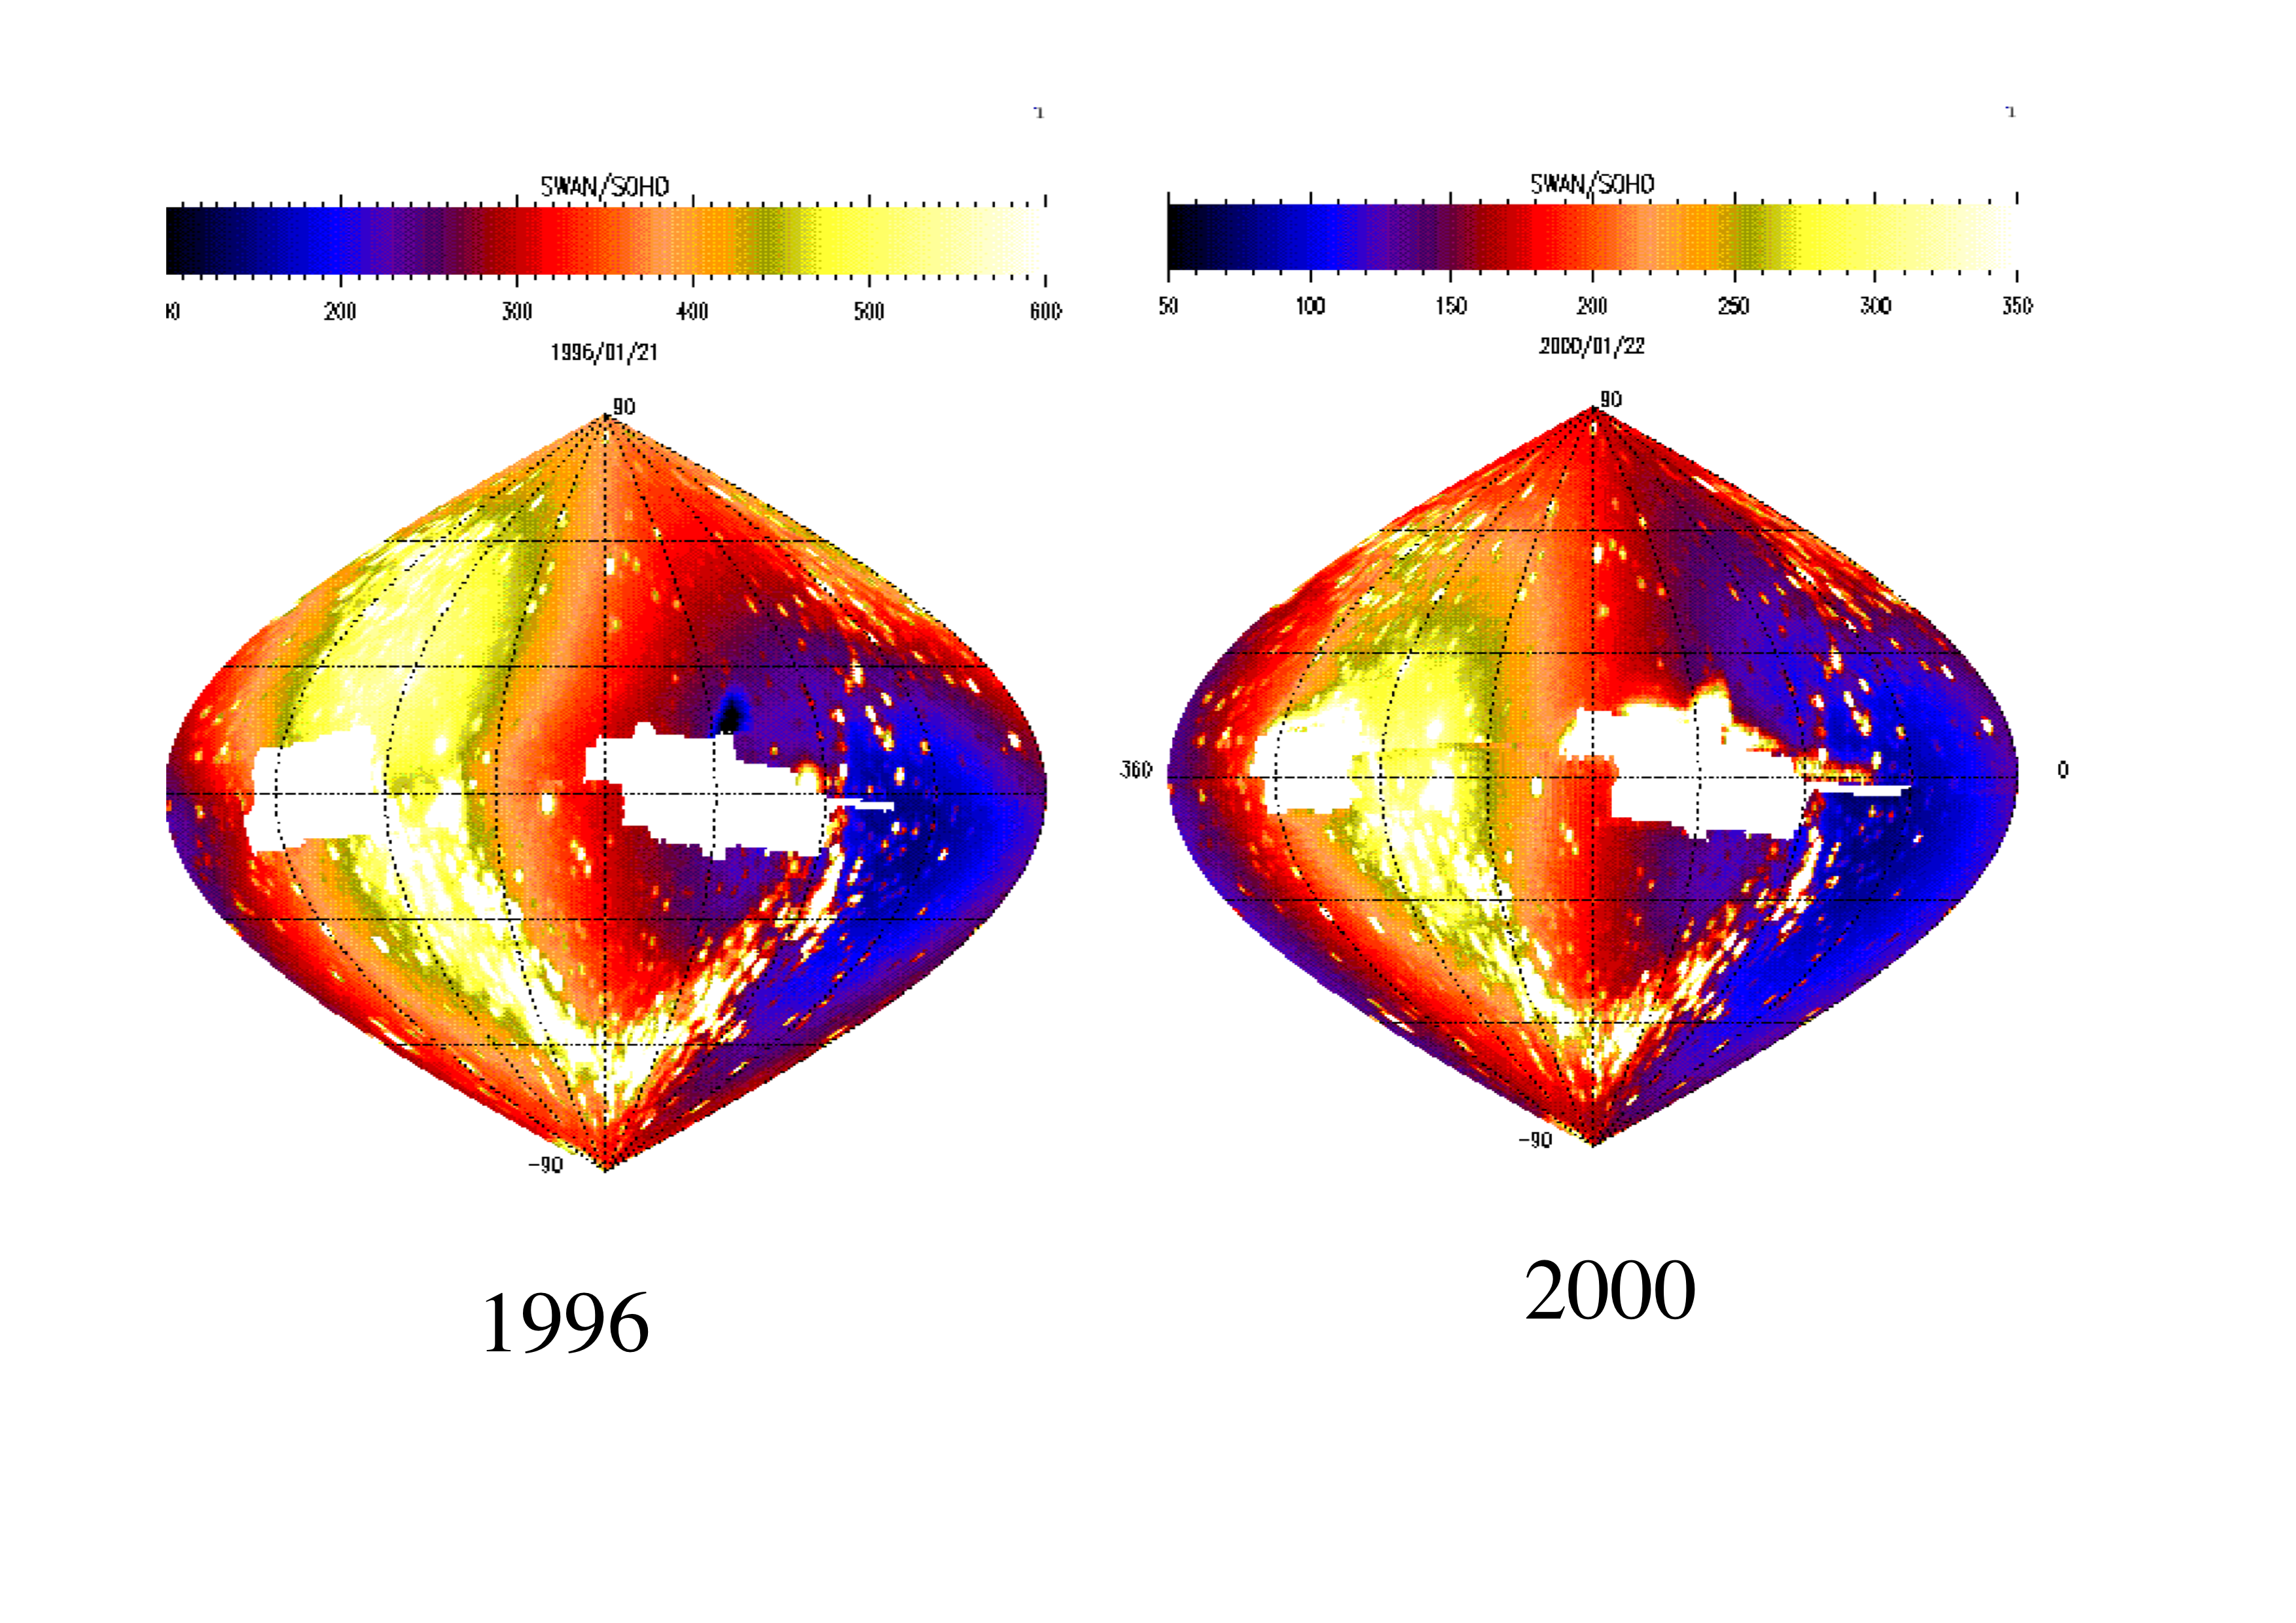
Typical SWAN maps at minimum and maximum activity: at minimum activity (1996) the maximum emission region is divided into two maximum brightness areas. This is due to the strong ionization along the solar equator, linked to the slow solar wind.
See publications (SWAN - Anisotropies NASA ADS)
Velocity field of interstellar neutral hydrogen from hcell data
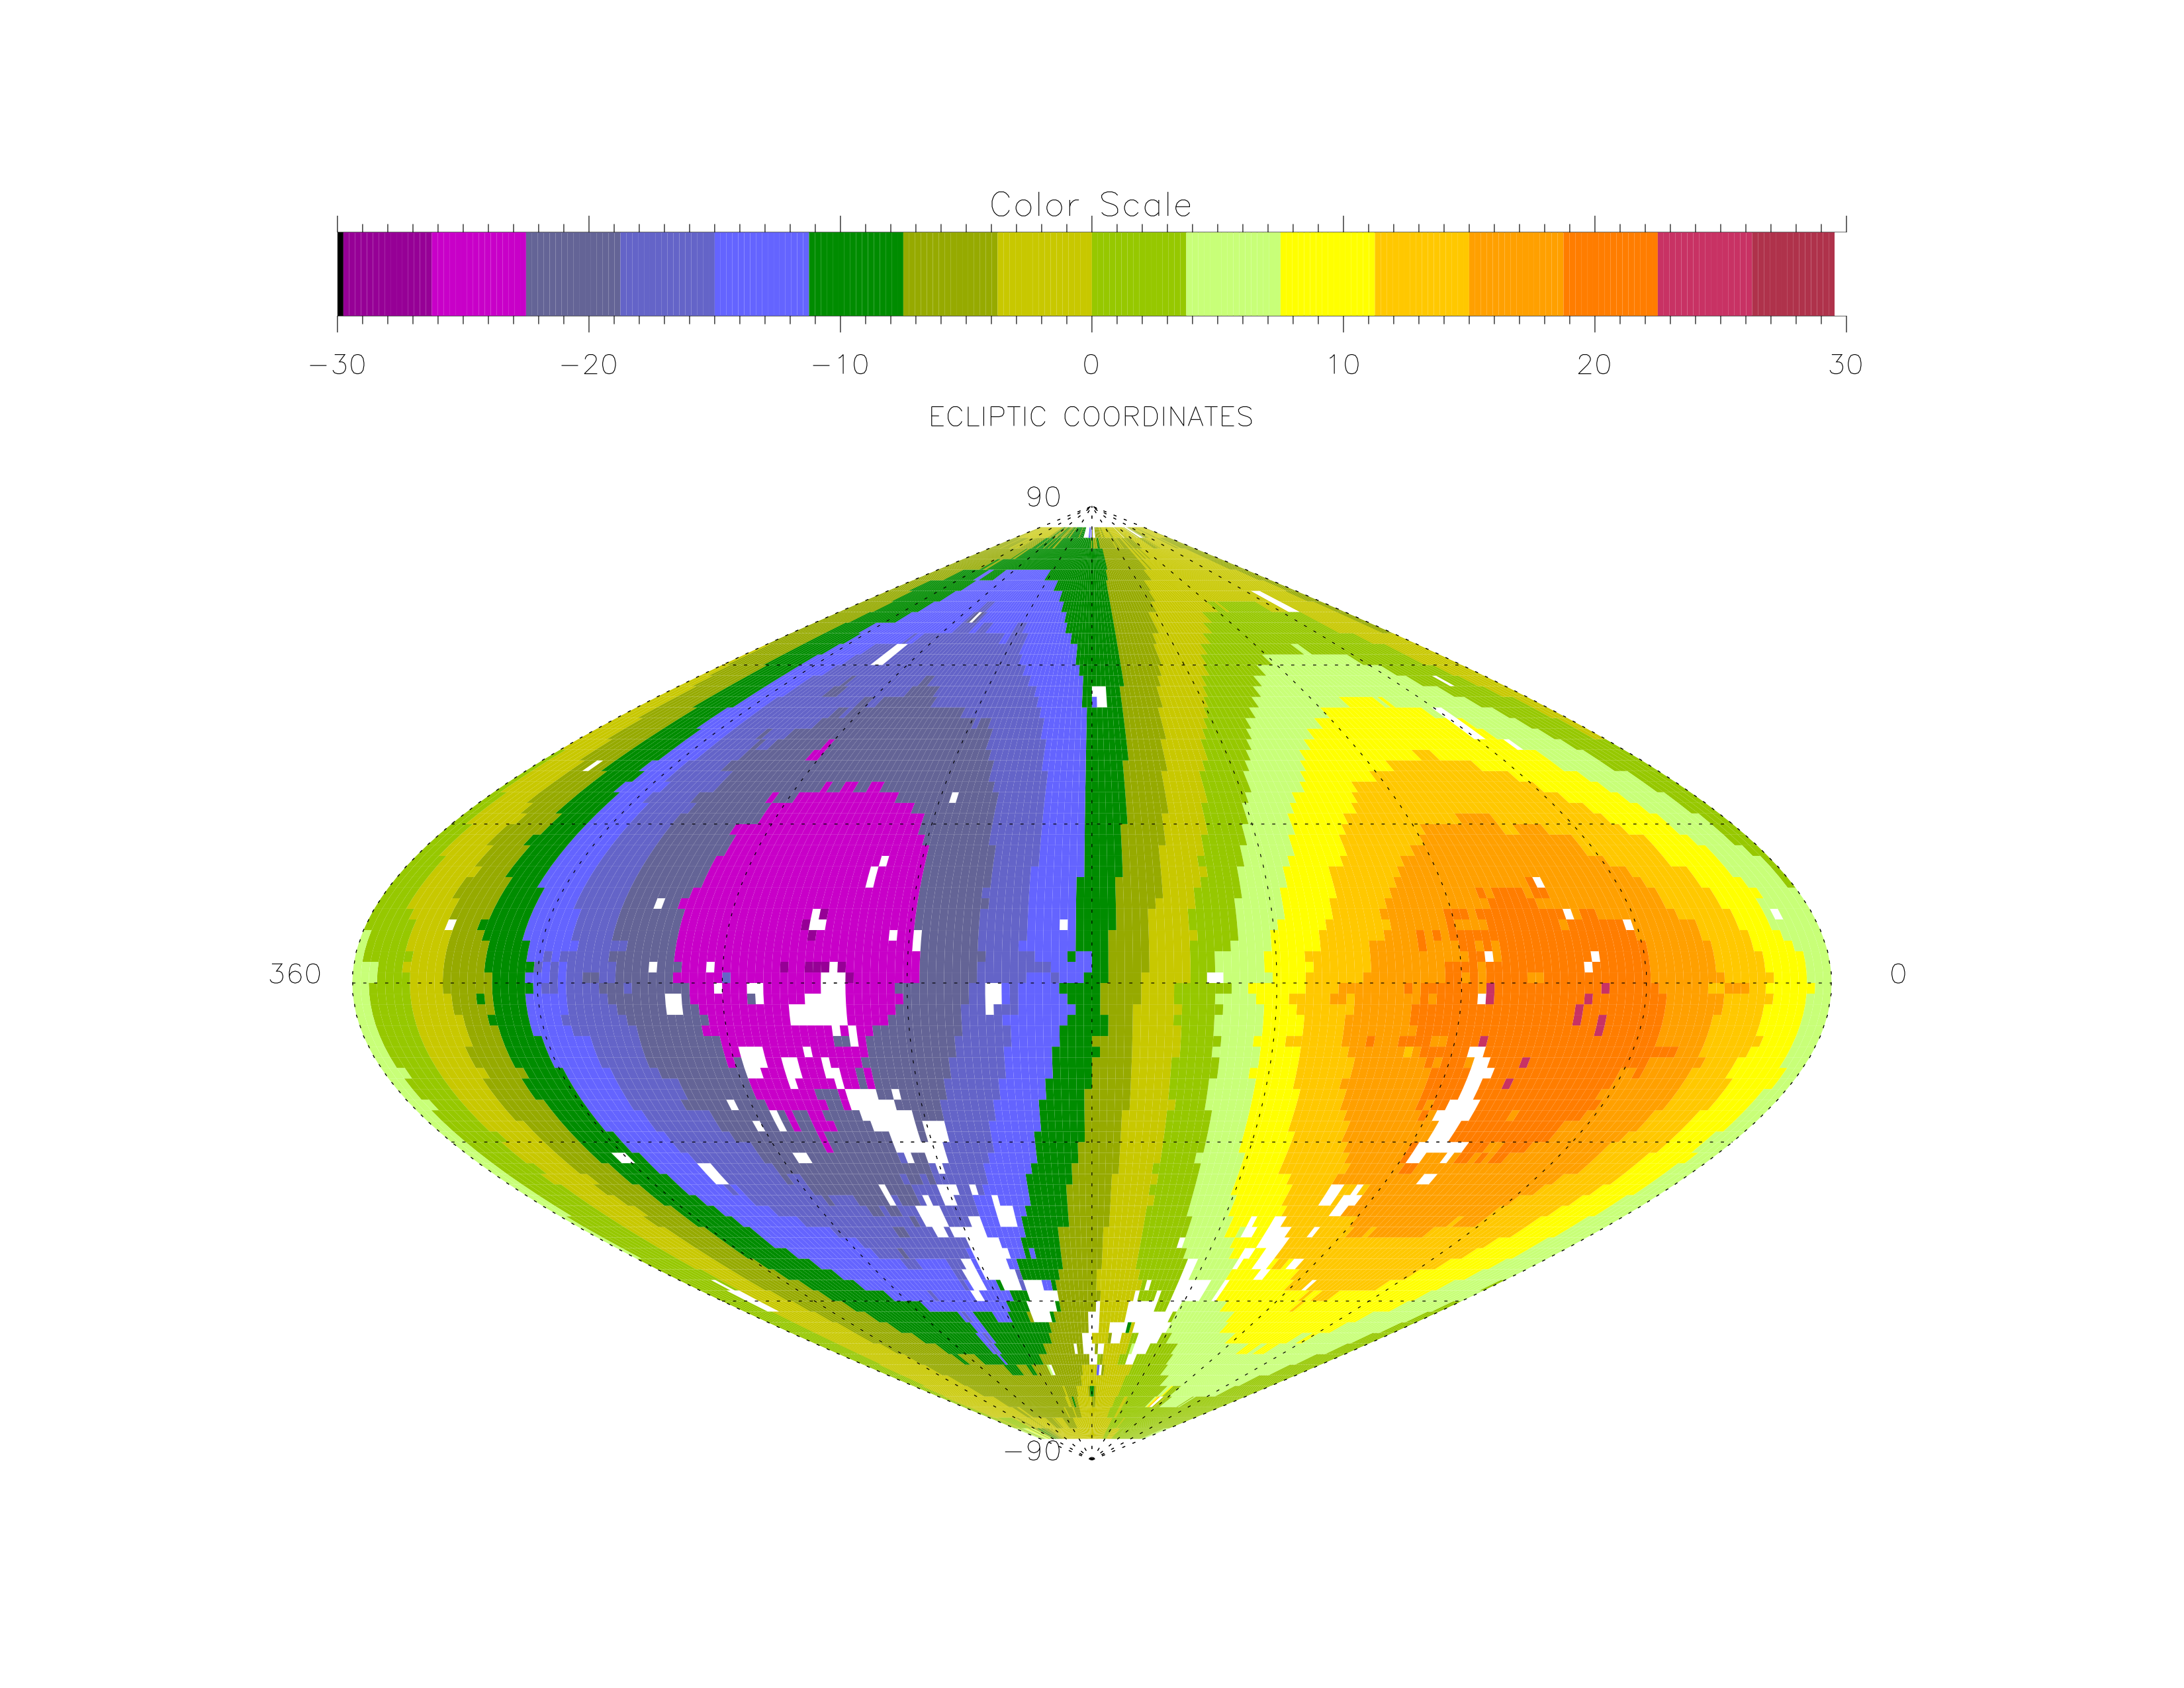
Full sky map of the interstellar hydrogen line-of-sight velocities: those velocities have been reconstructed using H cell information recorded during one year.
Interstellar H flow disturbance at the Heliospheric interface
From the measured velocity distribution of neutral H, and using the neutral helium flow properties for comparison, it has been shown that the H flow is experiencing significant perturbations across heliospheric interface.
- Deceleration
- Heating
- Filtration
- NEW! deflection: evidence for heliosphere distortion
See related publications (SWAN - Heliosphere-IS NASA ADS)
Comets
UV and optic image synthesis of comet Hale Bopp and ... |
the comet shadow!The H cloud blocks out the UV radiation that normally illuminates the sky. Therefore, we obtain the comet's shadow on the UV sky maps. Thus, Hale Bopp produced a shadow of 150 x 106 km long! |
Solar activity: The hidden face of the Sun
Active regions do emit more intense UV radiation, and produce brightness enhancements in SWA maps. These enhancements rotate like the Sun, and the interstellar gas acts as a giant 360 degrees screen around the Sun, which displays the rotating bright spots.
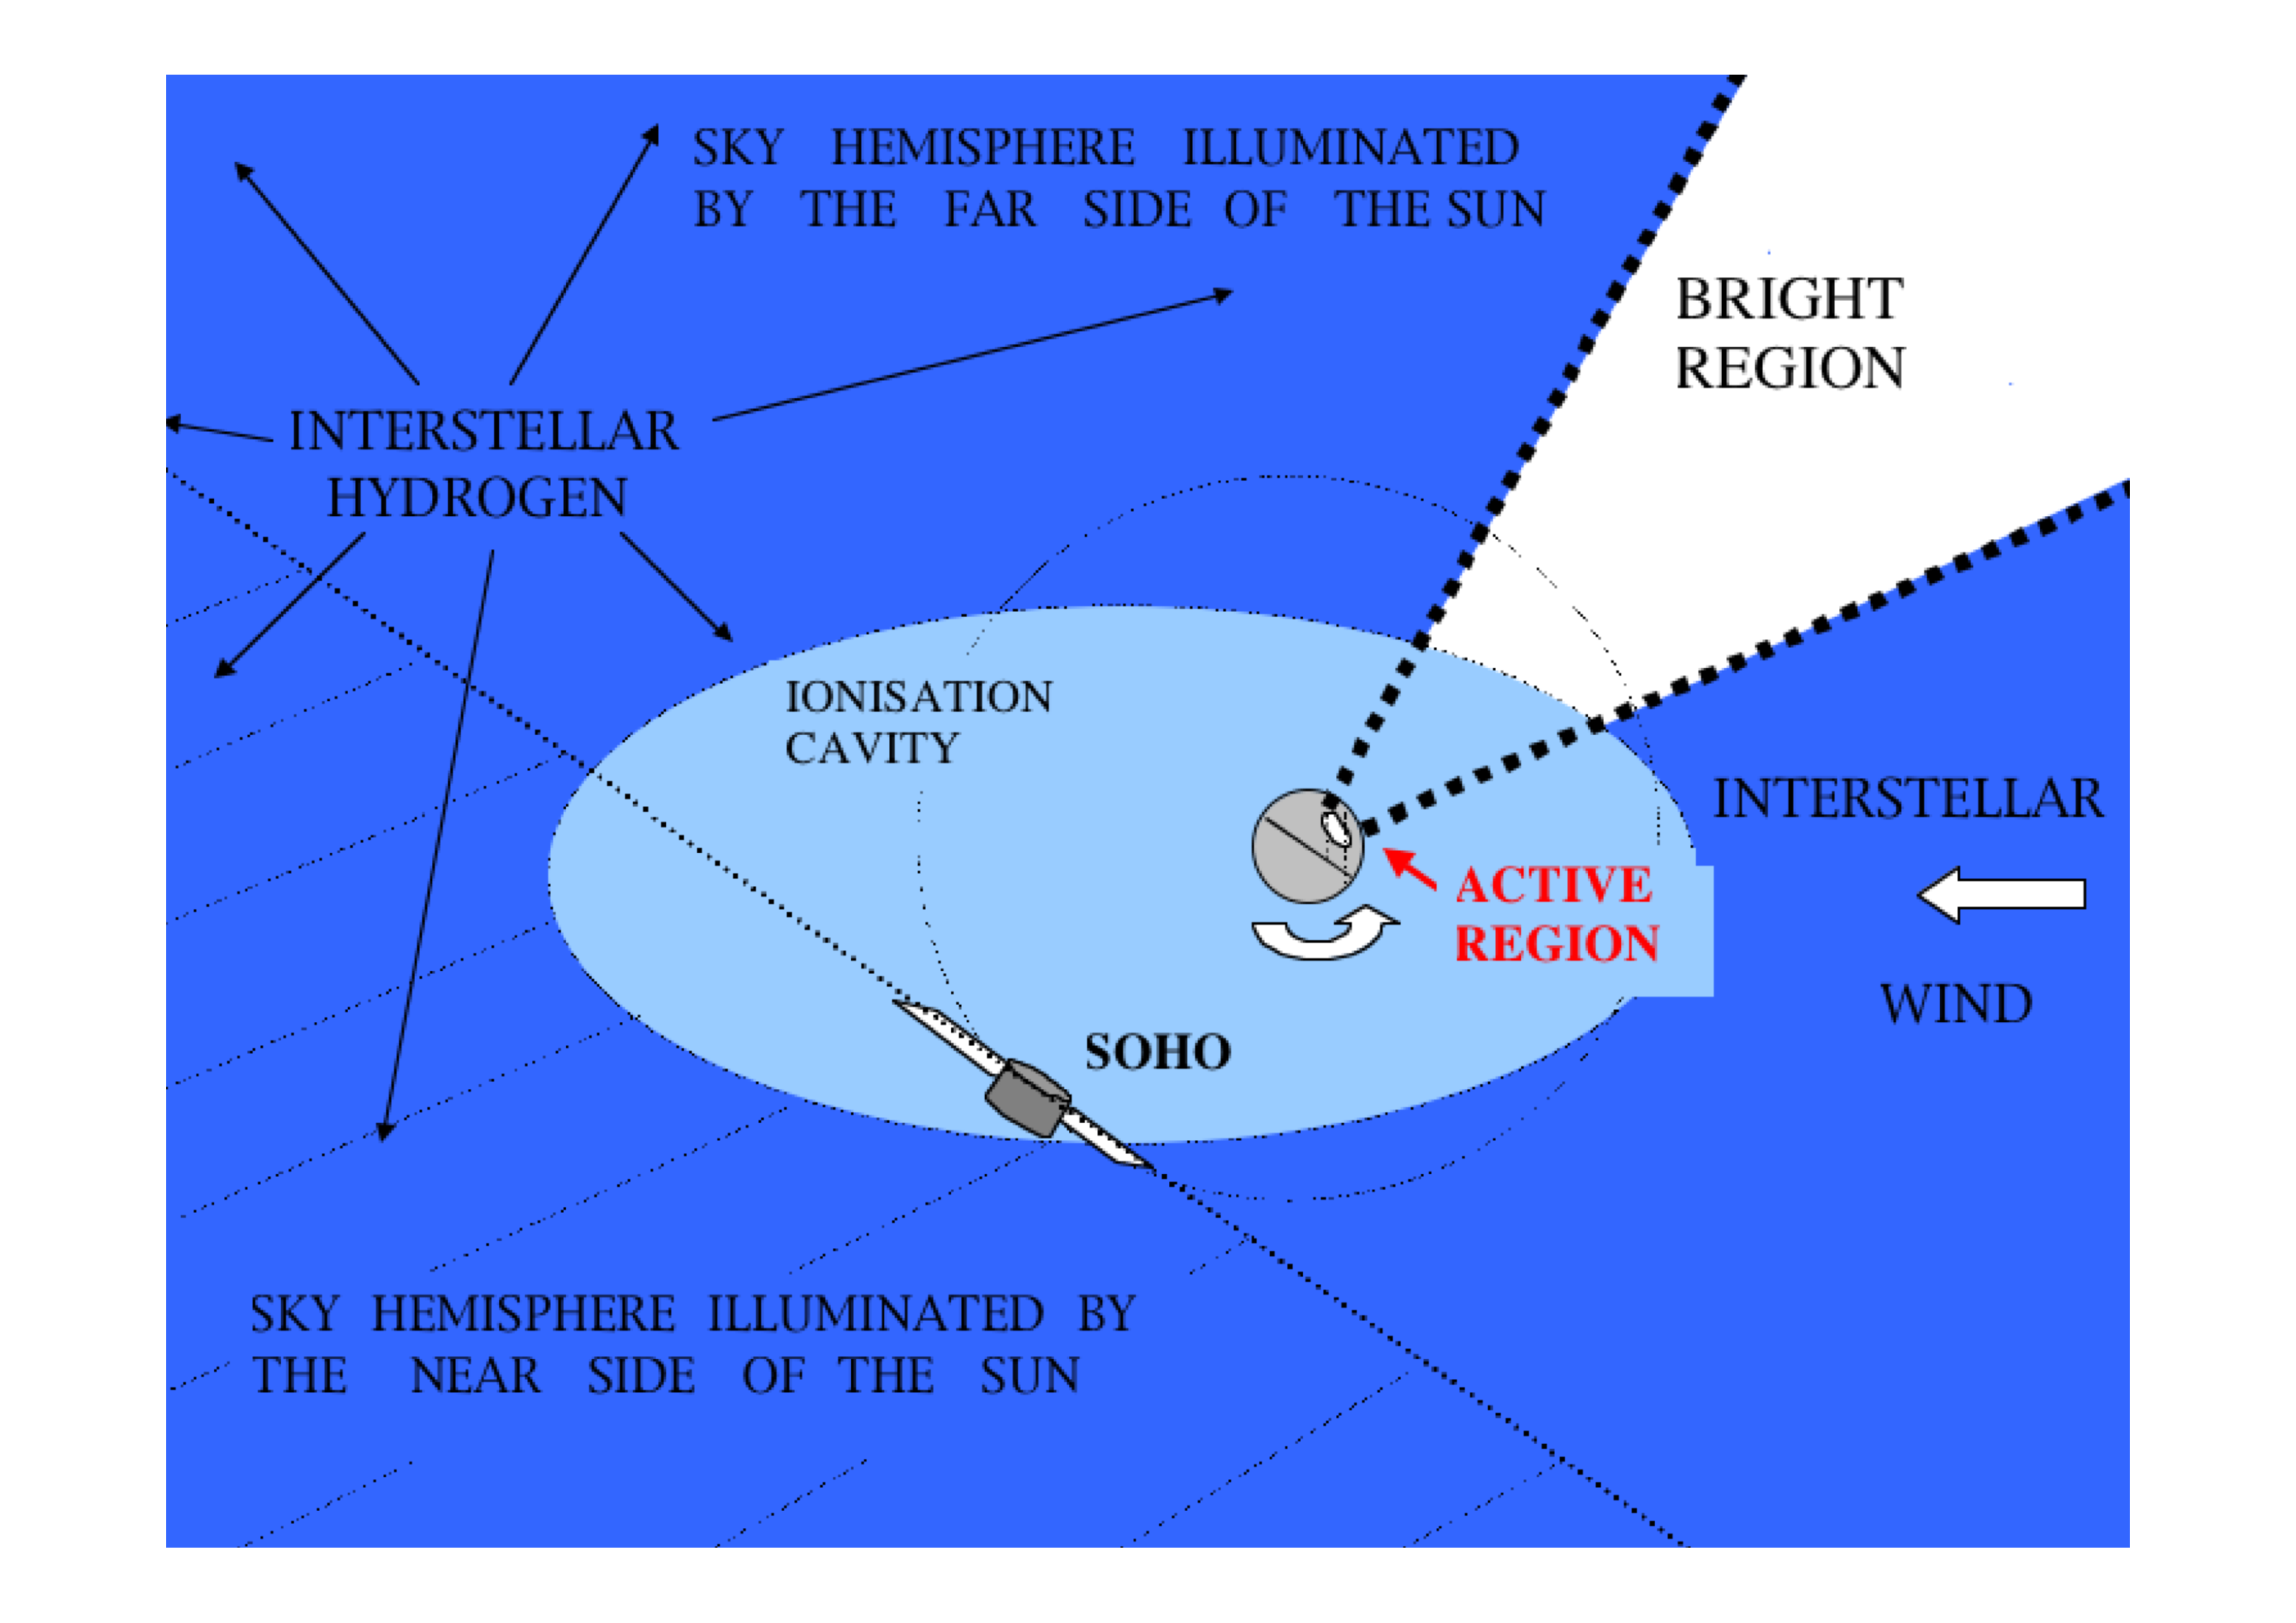
SWAN is thus detecting active regions on the far side of Sun, because they are reflected by the interstellar gas observed in the Sunward hemisphere. This can be used to PREDICT the solar activity up to 14 days in advance!!!